Load vs. deflection curves are graphical representations of how a rubber material deforms when it’s subjected to increasing force. For engineers, these curves provide valuable information about a rubber’s stiffness, compressibility, energy absorption, and suitability for parts like vibration mounts, seals and gaskets, or shock and impact pads.
This article defines load and deflection and explains how they differ. It also explains how to interpret load vs. deflection curves so that you can use them to compare rubber materials for parts you’re designing. Keep reading to learn more and contact Elasto Proxy if you need a rubber fabricator that also offers design reviews and help with material selection.
What Is Load?
Load is the amount of force that’s applied to the rubber material. It’s typically measured in pounds-force (lbf/in.) or newtons per millimeter (N/mm). Load can be applied through compression, tension, or shear; however, most load vs. deflection curves refer to compression. That’s because most rubber parts are compressed between two surfaces to provide sealing and/or insulation.
What Is Deflection?
Deflection is the amount of deformation or displacement the rubber undergoes under load. In other words, it describes how much the material compresses under a specific amount of force. Consider the example of a 0.500” (12.70 mm) thick rubber gasket that’s compressed to 0.425” (10.80 mm). The deflection is 0.075” (1.91 mm), which is the difference between the two measurements.
Load vs. Deflection: Understanding the Difference
Load and deflection are related, but they describe different aspects of a rubber’s behavior:
- Load is the input (i.e., the force applied).
- Deflection is the output (i.e., the resulting deformation).
A stiff rubber will have a small deflection for a high load. Conversely, a soft rubber will have a large deflection for a low load.
What does this mean under real-world conditions?
Consider the difference between a hockey puck and a pencil eraser. A hockey puck is stiff and deforms little when it’s hit by the blade of a stick. A pencil eraser is soft and deforms readily when it’s used to erase pencil marks from a piece of paper.
Understanding Load vs. Deflection Curves
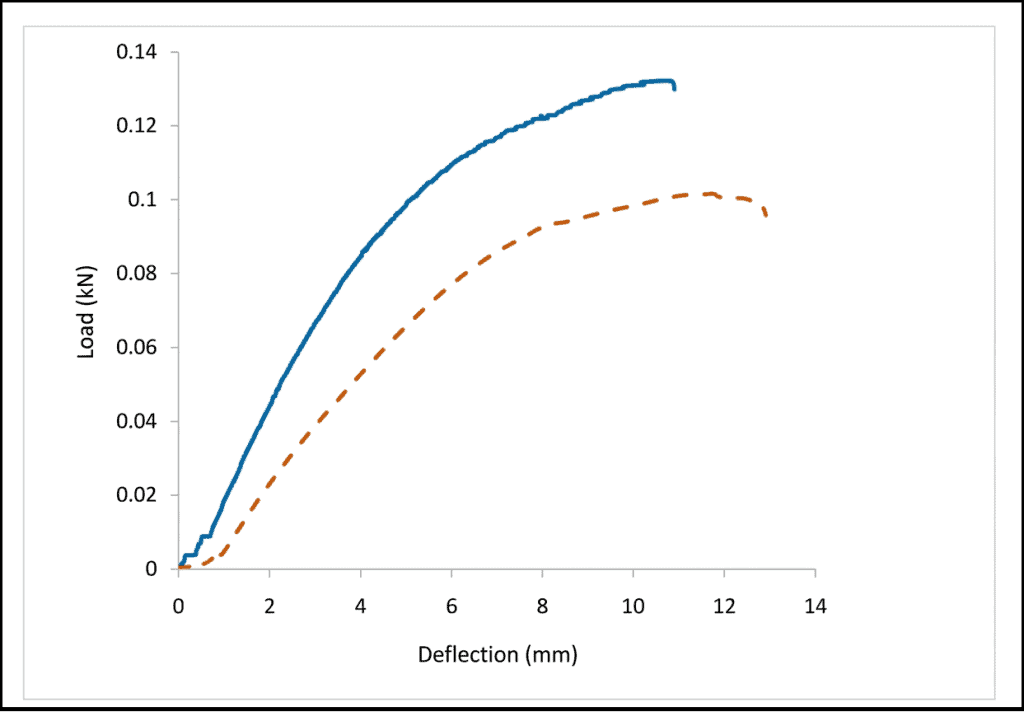
A load–deflection curve plots load on the vertical axis and deflection on the horizontal axis. As the rubber is compressed, the curve rises and shows how much force is required to achieve a specific amount of deformation. Most rubber materials have a curve with an initial low-slope region, an increasing slope region, and then a high-slope region.
Stiffness (Slope of the Curve)
The slope of the curve indicates compression stiffness, a material’s resistance to being squeezed, crushed, or reduced in size when a compressive load is applied. Stiff materials have steep slopes and soft materials have shallow slopes. In other words, a stiff rubber has a steeper slope and requires a greater amount of force to compress it.
Maximum Allowable Deflection
Maximum allowable deflection is the greatest distance (thickness) that a rubber material can safely compress under load. For solid rubber, the limit is usually 10% to 30% of the material’s original thickness. For foam or sponge rubber, the limit is typically 30% to 50%. Exceeding the maximum allowable deflection increases the risk of permanent compression set, which can cause seal failure.
Load Capacity
Load capacity is the greatest amount of force that a rubber material can withstand before structural failure occurs. It sounds a lot like maximum allowable deflection, so what’s the difference? The difference is that load capacity measures force, while maximum allowable deflection measures distance (thickness).
Nonlinear Behavior
The more you compress rubber, the harder it becomes to compress further. That’s because rubber consists of long, flexible molecular chains that move easily at first but then stiffen as deflection increases. Load vs. deflection curves illustrate this non-linear behavior.
Energy Absorption
A load vs. deflection curve doesn’t just show stiffness. It also indicates how much mechanical energy the rubber absorbs during compression.
- Stiff materials have steep curves and absorb more mechanical energy.
- Soft materials have shallow curves and absorb less mechanical energy.
What does this mean for rubber parts? Selecting a material with too little energy absorption can result in premature fatigue or excessive shock and vibration. Selecting a material with too much energy absorption is also problematic and can cause the rubber to allow excessive movement.
Practical Applications of Load vs. Deflection Curves
Here are several examples of how engineers use load vs. defection curves.
Vibration Mounts
Vibration mounts need to compress under load without bottoming out. Engineers use load vs. deflection curves to:
- Select a rubber hardness (durometer) that supports the equipment weight
- Ensure deflection stays within the allowable range
- Prevent excessive compression that reduces vibration isolation.
Example: You need vibration mounts for a 500-lb. (226.796 kg) generator. The parts must deflect 0.15” to 0.25” (3.81 mm to 6.35 mm) under load. You convert the generator’s weight into a unit of force. Then you compare load vs. deflection curves for 50, 60, and 70 durometer (Shore A) rubber to determine which hardness can meet your requirements.
Seals and Gaskets
Compression deflection determines sealing pressure. If the rubber material is too soft, the gasket extrudes out of the gap. If the rubber is too stiff, it might not conform to surface irregularities.
Load vs. deflection curves help engineers:
- Predict the amount of compression force needed for sealing
- Ensure the gasket compresses enough to fill gaps
- Avoid over-compression (i.e., permanent compression set) that damages the seal
Example: You’re designing an outdoor gasket that must compress 20% under a clamping load of 30 lbf/in (5.25 N/mm). You compare curves for EPDM and silicone in various durometers since both materials are weather-resistant.
Shock and Impact Pads
Rubber pads absorb energy through deformation. Load vs. deflection curves show:
- How much energy the pad can absorb
- Whether the pad bottoms out under impact
- How stiffness changes at high strain
Example: You’re designing a polyurethane pad for use under heavy machinery. It must absorb heavy impact loads without excessive deflection. You select a 90 durometer (Shore A) polyurethane because of its steep load vs. deflection curve.
Get Greater Value with Elasto Proxy
Elasto Proxy is more than a rubber fabricator or distributor. We also offer value-added services like design reviews and help with material selection. If you’re looking for a manufacturing partner that does more, we invite you to talk to our team.